Side project · Fair MLB odds, every day
Slam Picks
Sportsbooks publish a price for every MLB game. Slam Picks builds its own, then shows exactly where the books disagree.
01 · The elevator pitch
What it is
Slam Picks estimates every player's true talent, simulates each MLB game thousands of times, and prices every market from the results: moneyline, totals, run line, first five, and player props. The books charge vig; the model strips it out and compares fair numbers to fair numbers. The gap between the two prices is the product.
It runs itself: a morning job captures the slate and prices it, a sweep re-prices each game the moment its lineup is confirmed, and yesterday's calls are graded against what actually happened. The repo is private, but the whole methodology is public on the site.
02 · The priors
The talent layer
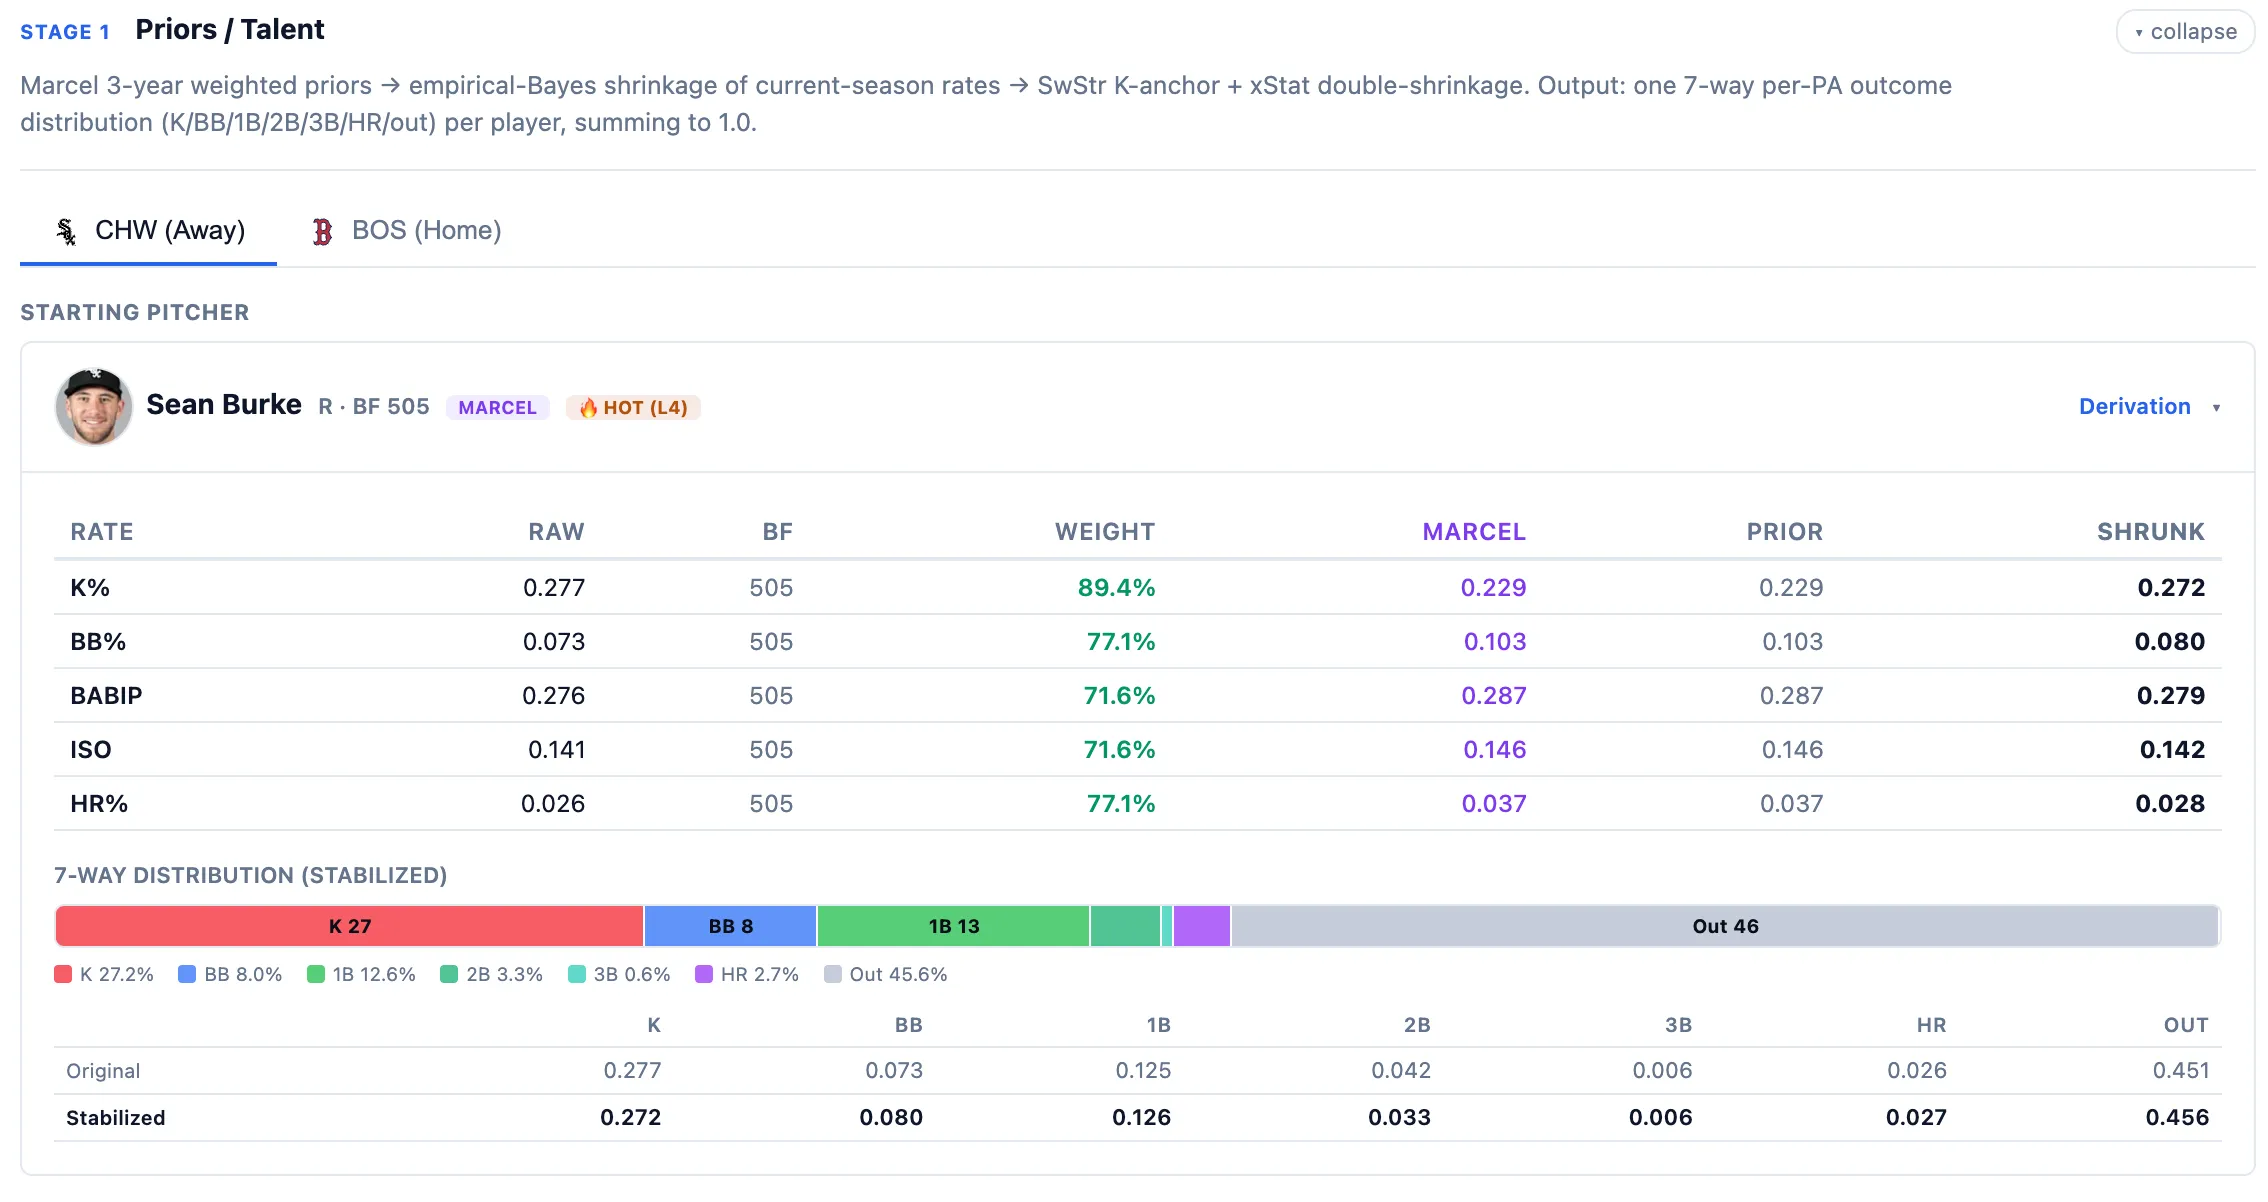
Small samples lie, so no raw stat enters the model. Every rate is shrunk toward a player-specific prior built from three years of weighted history, and how far it shrinks depends on the stat: strikeout rate stabilizes fast, contact quality slowly. A veteran's hot week barely moves him; a rookie with no track record moves fastest.
Contact quality gets extra care: the model anchors on Statcast expected-contact data (exit velocity and launch angle, with defense, park, and luck stripped out) instead of box-score results. Platoon splits regress by the size of the split itself, batter and pitcher merge through odds-ratio math that amplifies shared tendencies instead of averaging them away, and park factors apply per stat. That stabilized 7-way distribution (the hero shot above) is what every simulated plate appearance draws from.
03 · The engine room
The simulation
The simulator plays baseball, not statistics: one plate appearance at a time, drawn from each matchup's 7-way outcome distribution, through nine innings and extras. The starter tires as his estimated pitch count climbs, a manager model decides when to pull him (tuned against roughly 1,900 real starts), and a league-average bullpen finishes the game, re-merged against every batter it faces.
Before pricing, a root-finder tunes each starter's pull timing so his simulated workload lands on his real one, probing with the same random seed so only the pull moves. Outing length emerges from the simulated game instead of being patched on afterward.
| Sim #1,847 | 1 | 2 | 3 | 4 | 5 | 6 | 7 | 8 | 9 | R |
|---|---|---|---|---|---|---|---|---|---|---|
| CHW | 0 | 1 | 0 | 0 | 2 | 0 | 0 | 0 | 0 | 3 |
| BOS | 2 | 0 | 0 | 1 | 0 | 0 | 2 | 0 | x | 5 |
One of thousands per matchup · every cell a chain of plate appearances
04 · The receipts
Proving it
Two engines, one baseball. The Monte Carlo simulator is paired with an exact Markov solver that enumerates every branch of an inning instead of sampling, and both share the same transition math, so the sim's average must converge to the closed-form answer. That check runs in the test suite over 60,000 innings, and again live on the site for every simulated game.
The paranoia goes deeper. A compiled C kernel runs the inner loop about 7x faster, but only after proving itself bit-for-bit identical to the Python loop on the machine it deploys to; if the platform's math library disagrees by a single bit, it silently steps aside. And backtests can't cheat: the schema stores per-day count deltas so a point-in-time read is a sum over dates (future leakage is unrepresentable, not just avoided), and a validator walks every stored pitch row to reject any snapshot that touches the future.
Δ 0.02 · matchtwo algorithms, one answer
05 · The market
Pricing the disagreement
Odds come in from a commercial feed, get de-vigged, and line up against the model's fair prices. Ten markets are graded end to end against real outcomes, reconciled from two independent sources, and the model's closing-line odds are captured near first pitch for every game.
The scoreboard is honest: the site tracks ROI, closing-line value (did the market move toward the model's number by first pitch), and Brier score on win probabilities, with deeper error metrics checked in offline backtests. A strategies workbench replays graded history under different staking rules, fractional Kelly included. Live automated staking is deliberately still on the roadmap.
06 · War stories
Production stories
The deploy that dropped a third of its traffic
The site deploys itself from a Mac mini: push to main, Coolify builds the image, health-checks the new container, and swaps traffic behind a Cloudflare Tunnel with no open ports. Measuring the swap showed a third of requests hitting the dying container for 16 seconds. A hand-written Traefik retry middleware closed the gap: 138 of 138 probes clean through a rolling deploy.
The test harness that lied
Every speedup must prove it changed nothing: an equivalence harness demands byte-identical output before an optimization counts. It once reported PASS while comparing zero rows. Now every check needs a negative control that proves it can fail, and the performance notes keep a numbered list of sixteen methodology pitfalls that each produced a wrong answer at least once.
07 · The product
Screenshots
The whole methodology is public: the site walks its five-stage pipeline on a real game, and a derivation page shows any player's projection being built.


08 · The toolbox
Stack
- Model
- Python 3.12, NumPy, Pydantic v2, Cython kernel
- API
- FastAPI
- Frontend
- React 19, TypeScript, Vite
- Data
- Neon Postgres (Prisma migrations, SQLAlchemy runtime)
- Infra
- Docker, Coolify on a Mac mini, Cloudflare Tunnel, self-hosted CI runners
A clean-room rebuild of a v1 that grew up inside a monorepo: typed contracts instead of nested dicts, 1,216 unit tests, and a daily pipeline that runs without anyone watching.
Postgame
See it live
Fair MLB odds, every day, priced by a model that shows its work.